После падения ниже $54 000 биткоин частично восстановил утраченные позиции и вырос до $57 250. В свою очередь, цена Ethereum преодолела важный ценовой порог в $3000. Эксперты Cryptology сделали технический анализ и cпрогнозировали дальнейшее движение цен по этим активам.
Биткоин
Начнем со старших таймфреймов. На месячном графике биткоина наблюдается хороший разворот. Отдельно отметим импульс на открытии нового месяца, где мы частично протестировали зону имбаланса. Самое главное — не опуститься ниже нового минимума месяца.
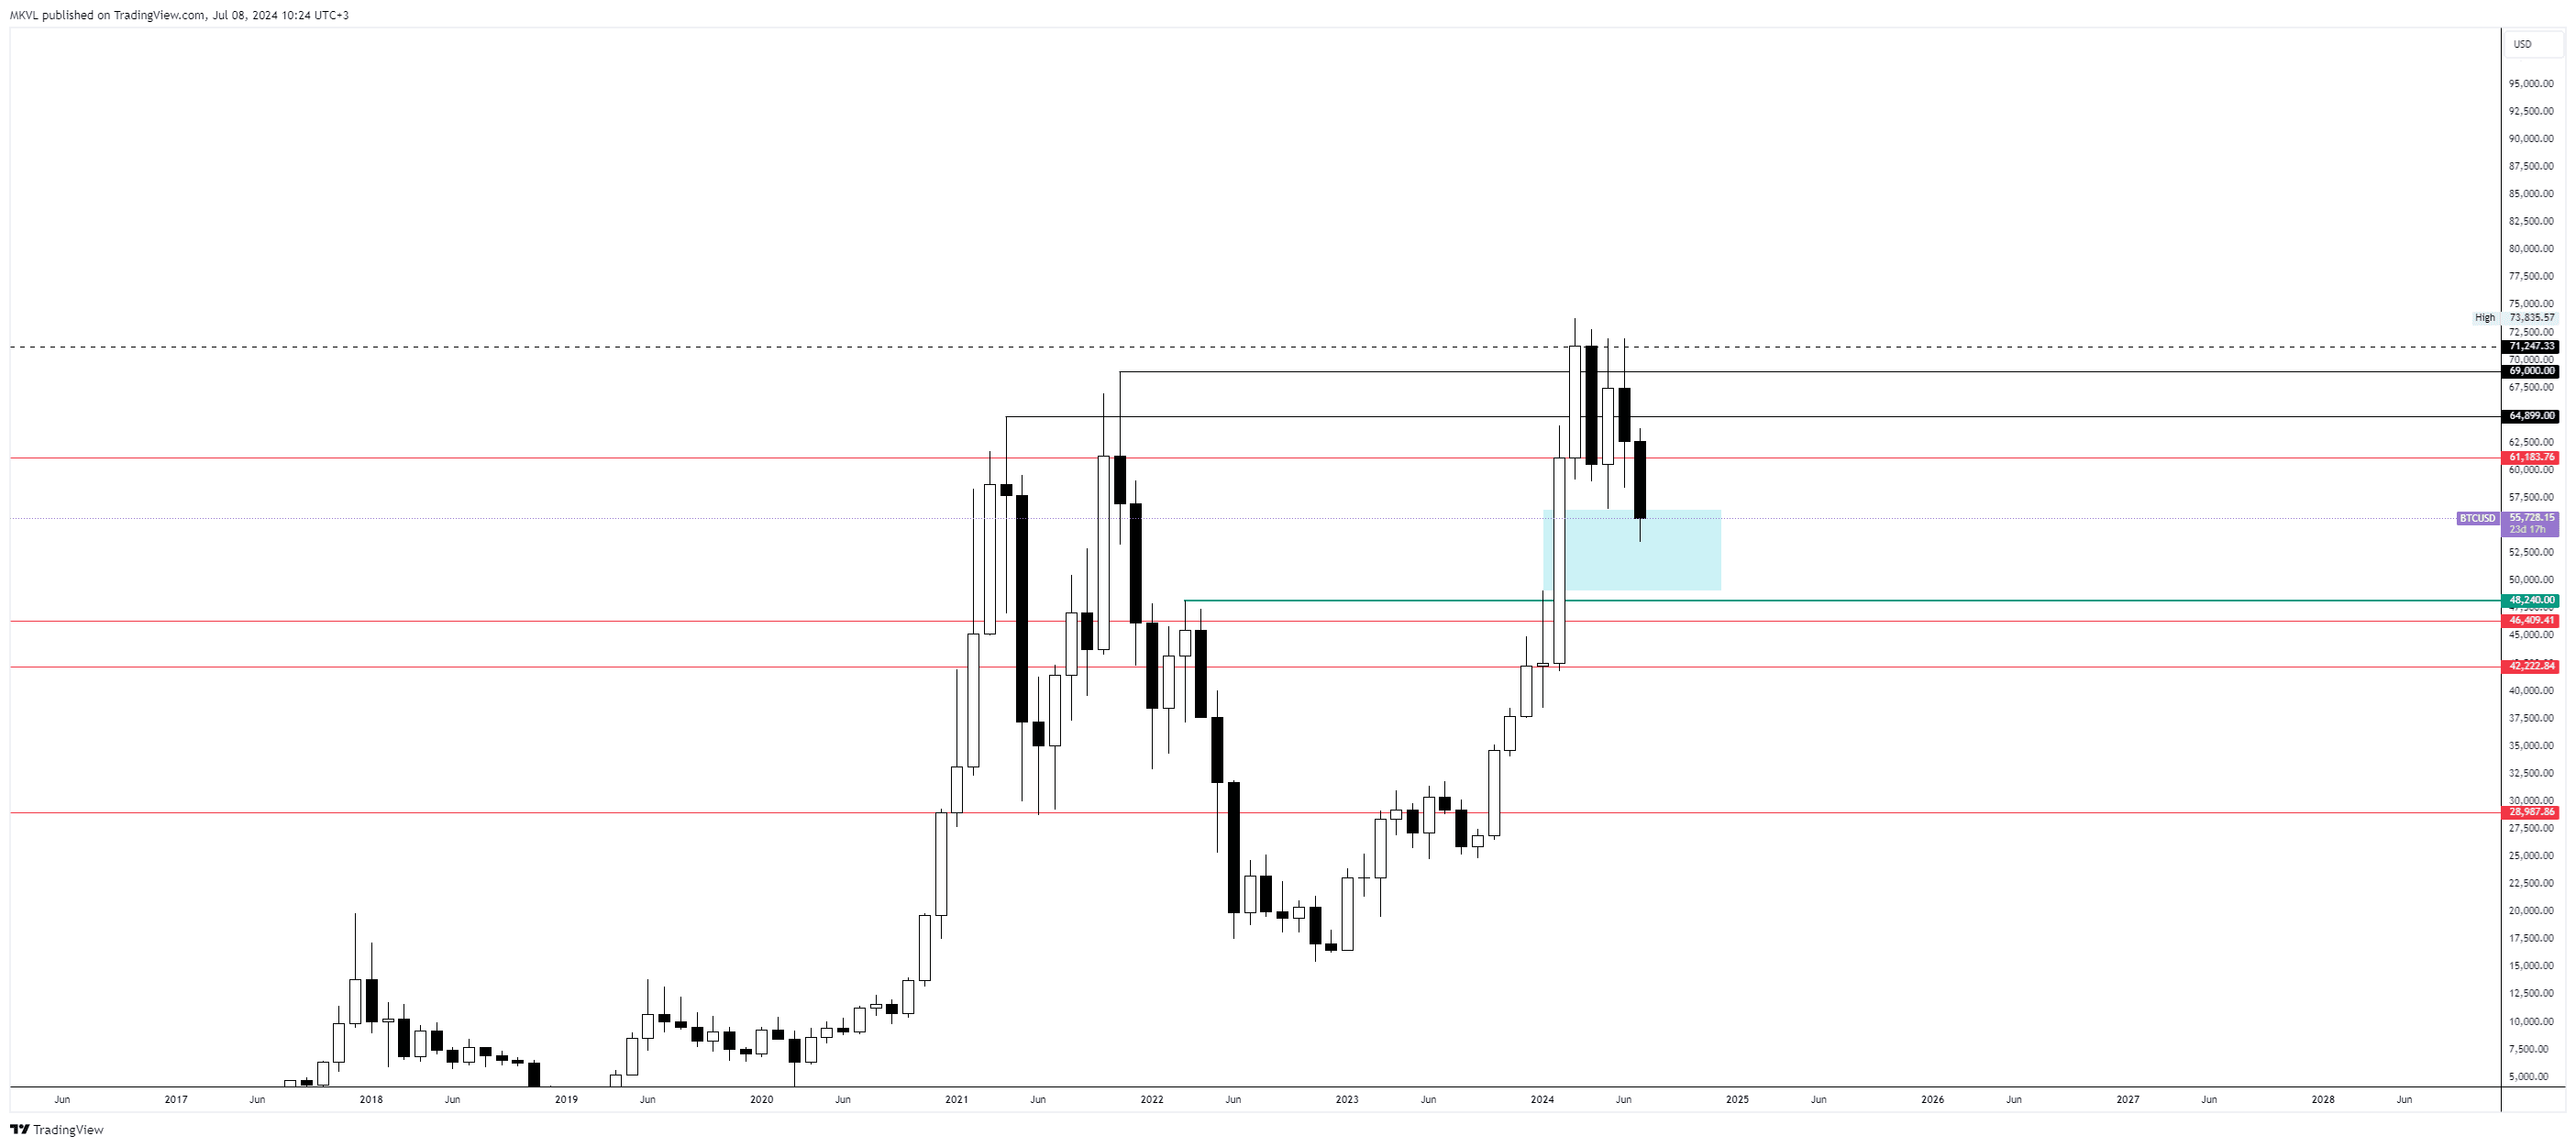
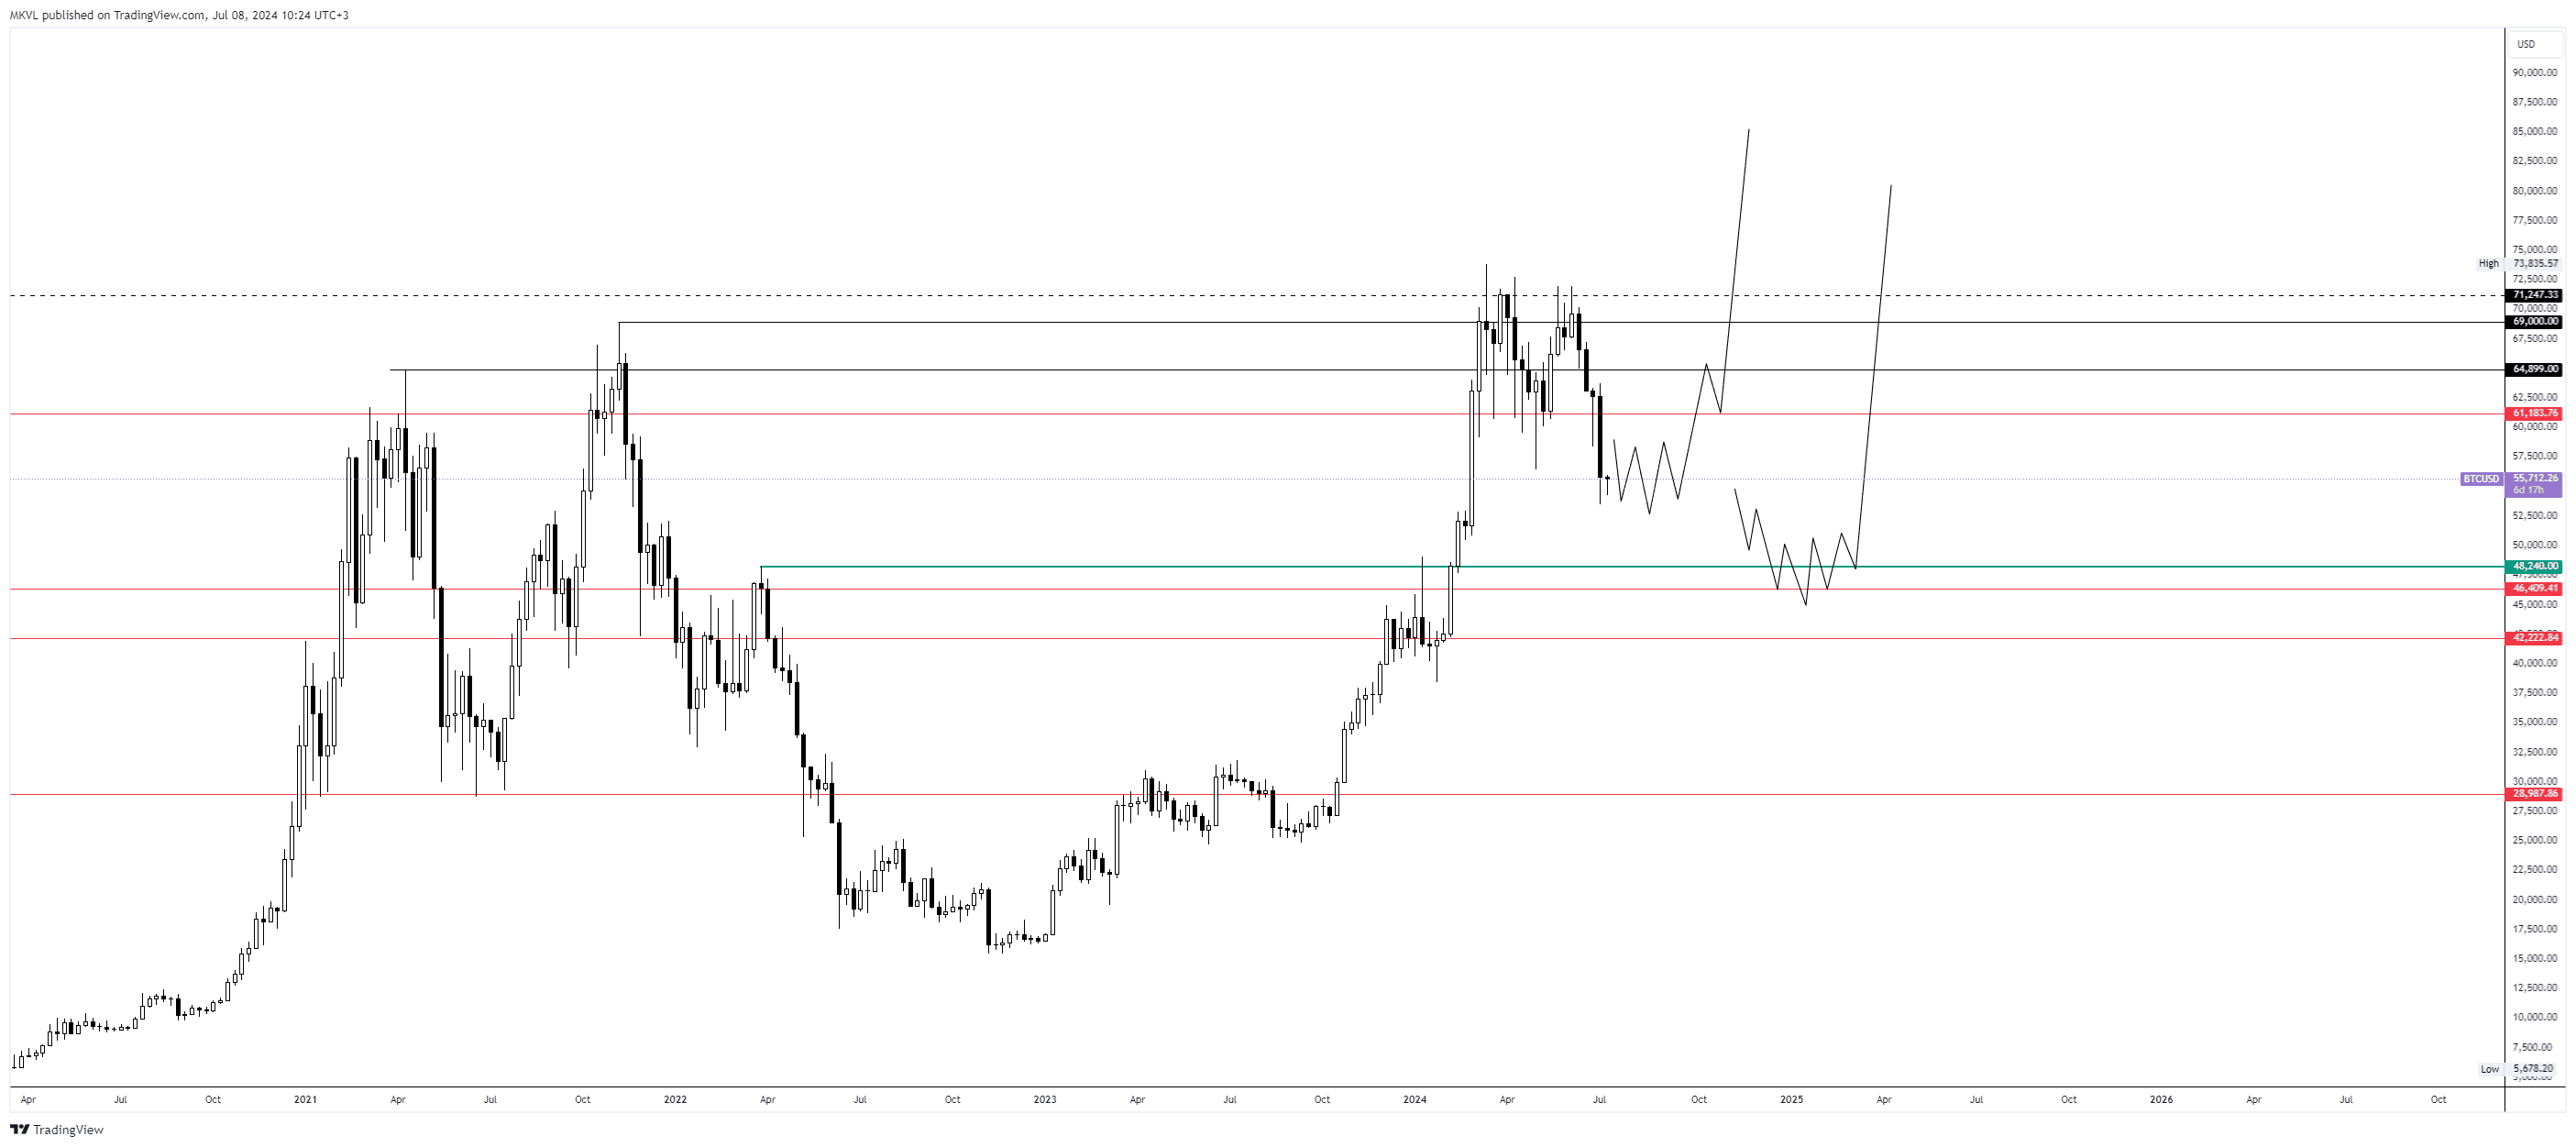
На недельном чарте курс биткоина демонстрирует явную слабость. Вероятнее всего, нас ждет консолидация на одном месте или заход еще ниже — в зону $48 000.
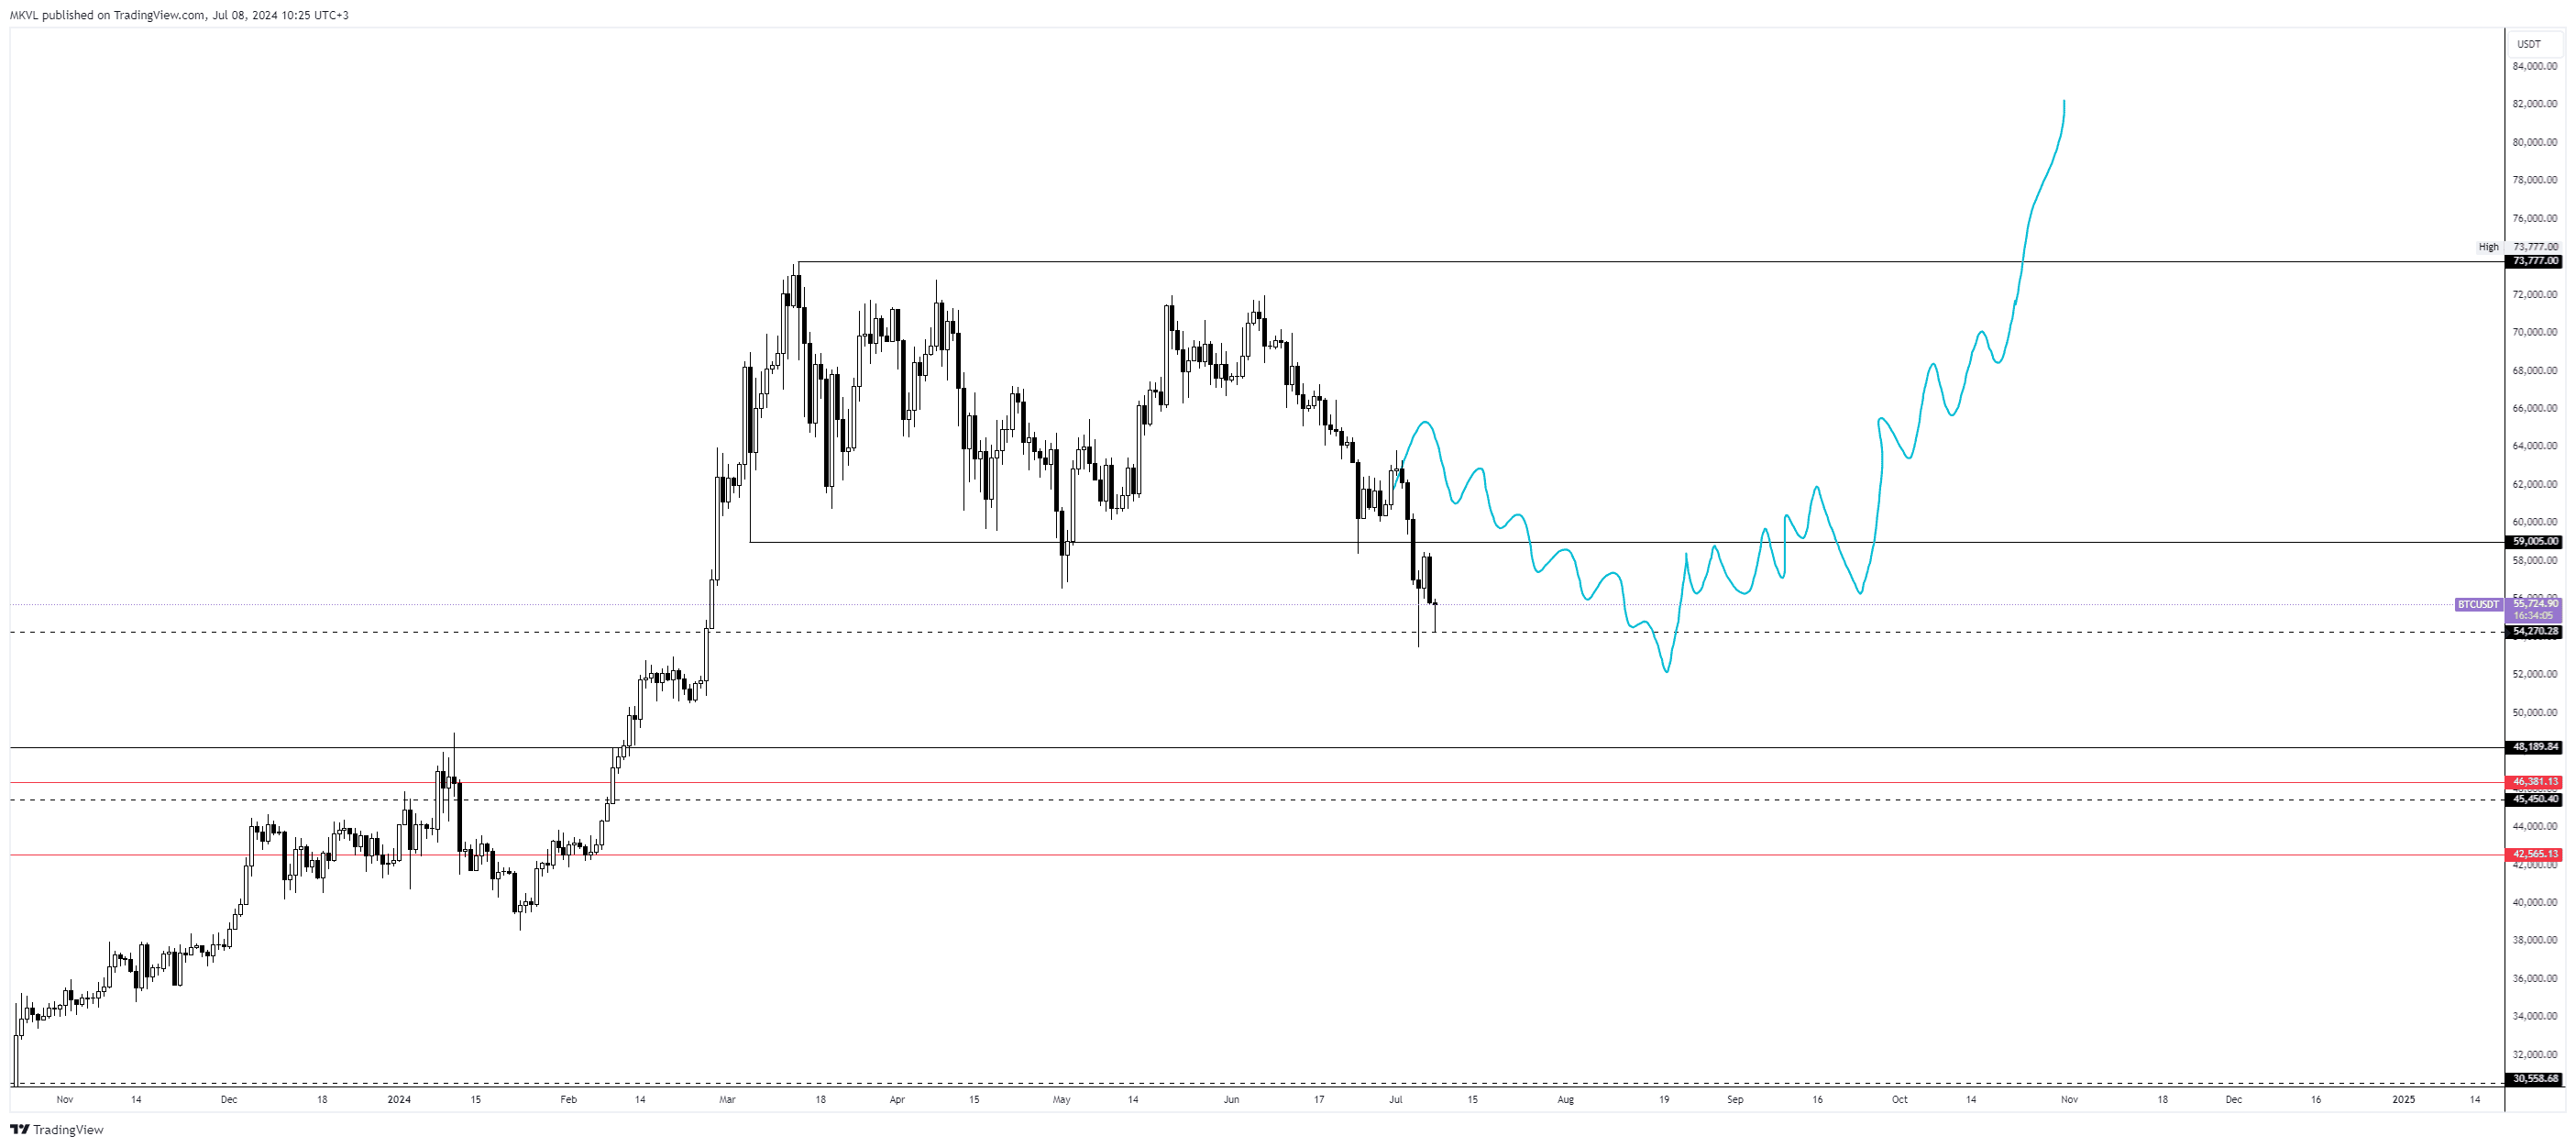
В одном из недавних обзоров был сделан детальный разбор дневного графика биткоина. Цена четко ударилась в $54 720, после чего произошел хороший откуп. Такая реакция покупателей создает предпосылки для оптимистичного прогноза. Чтобы сценарий оставался актуальным, нам нужно находиться в этом узком диапазоне перед началом полета.
Ethereum
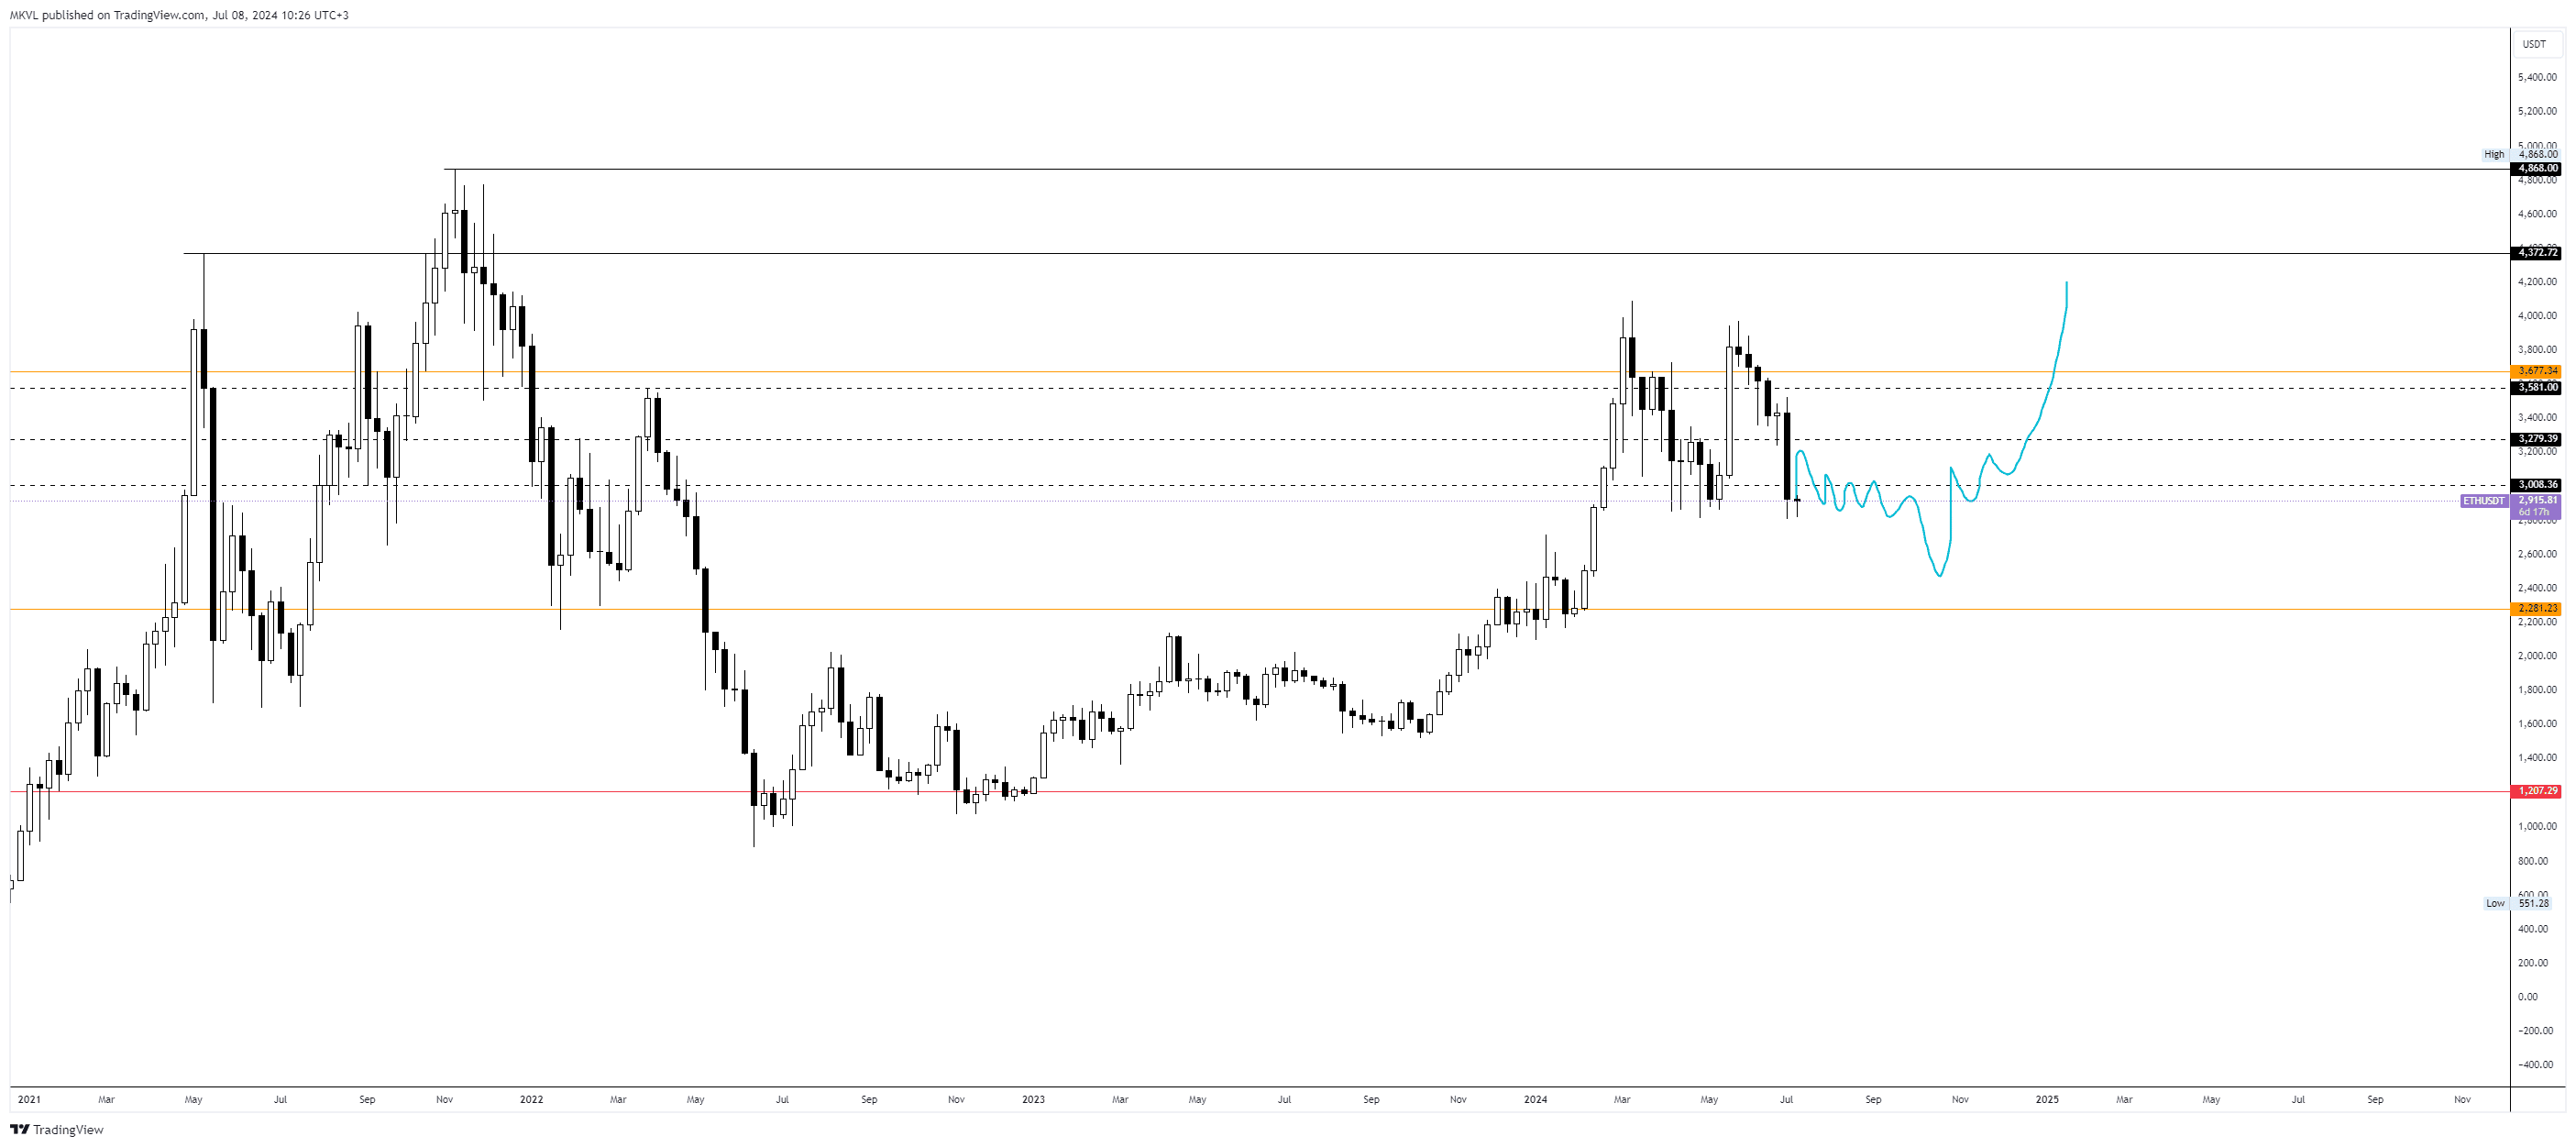
Сильная майская свеча Ethereum была почти полностью перекрыта обвалом. Но шансы на дальнейший рост еще есть. Следим за реакцией покупателей — если они смогут выкупить актив, а месячная свеча закроется выше минимума предыдущего месяца, нас ждет оптимистичный сценарий. Если этого не произойдет, скорее всего, произойдет еще одно снижение цены.
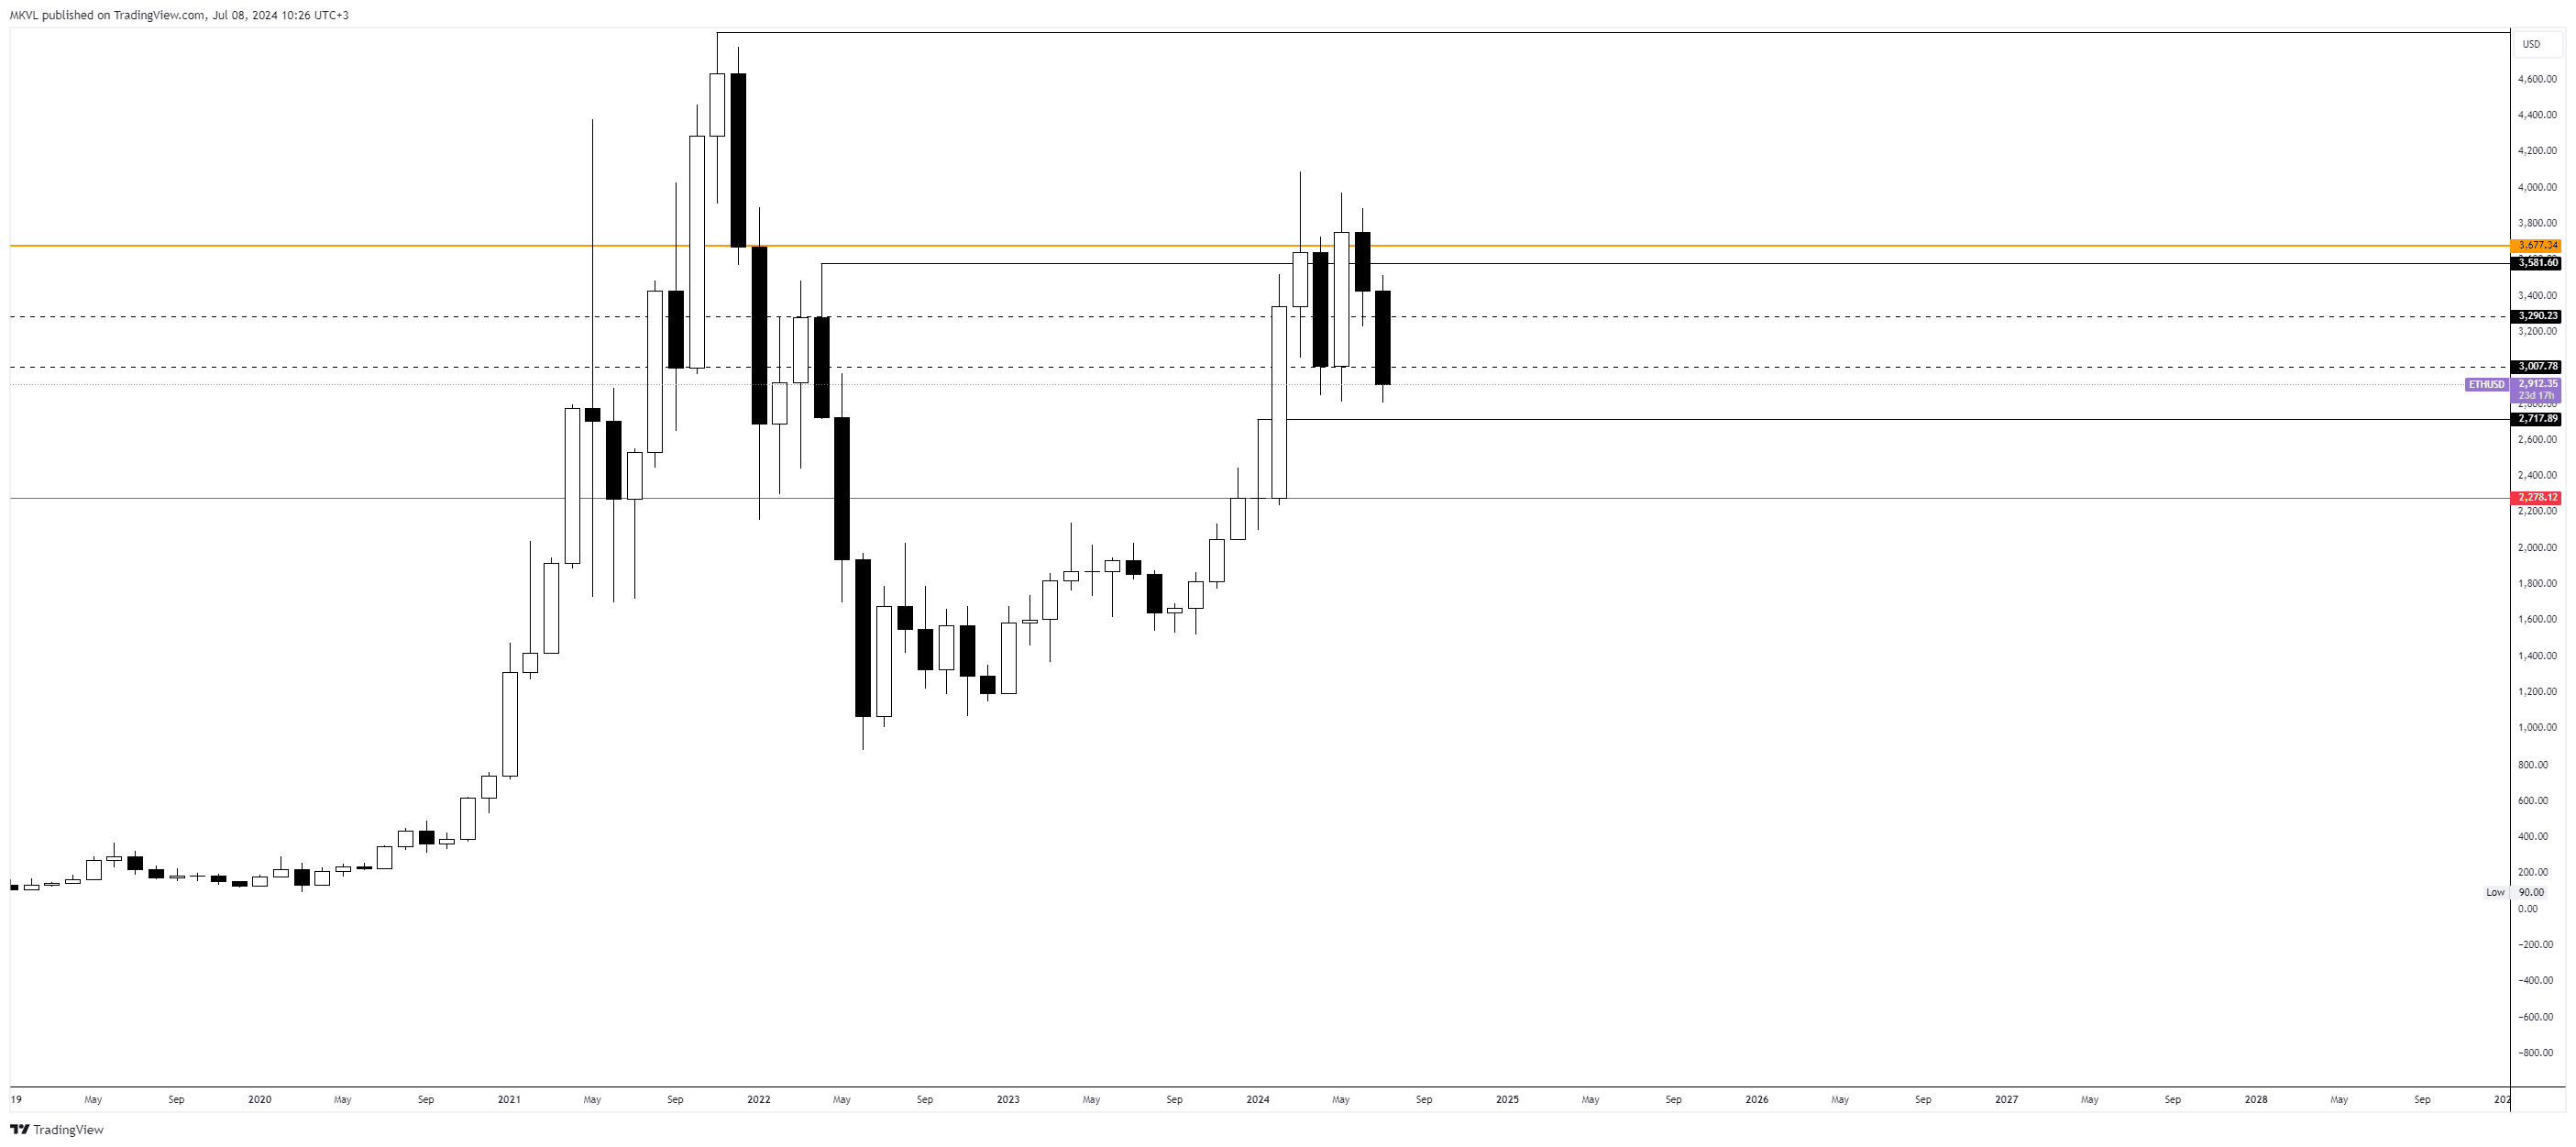
На недельном таймфрейме ситуация почти полностью аналогична месячному графику. Исходя из того, что сегодня открытие новой недели, мы увидим поглощение свечи за два бара или, наоборот, повторное снижение к $2717.
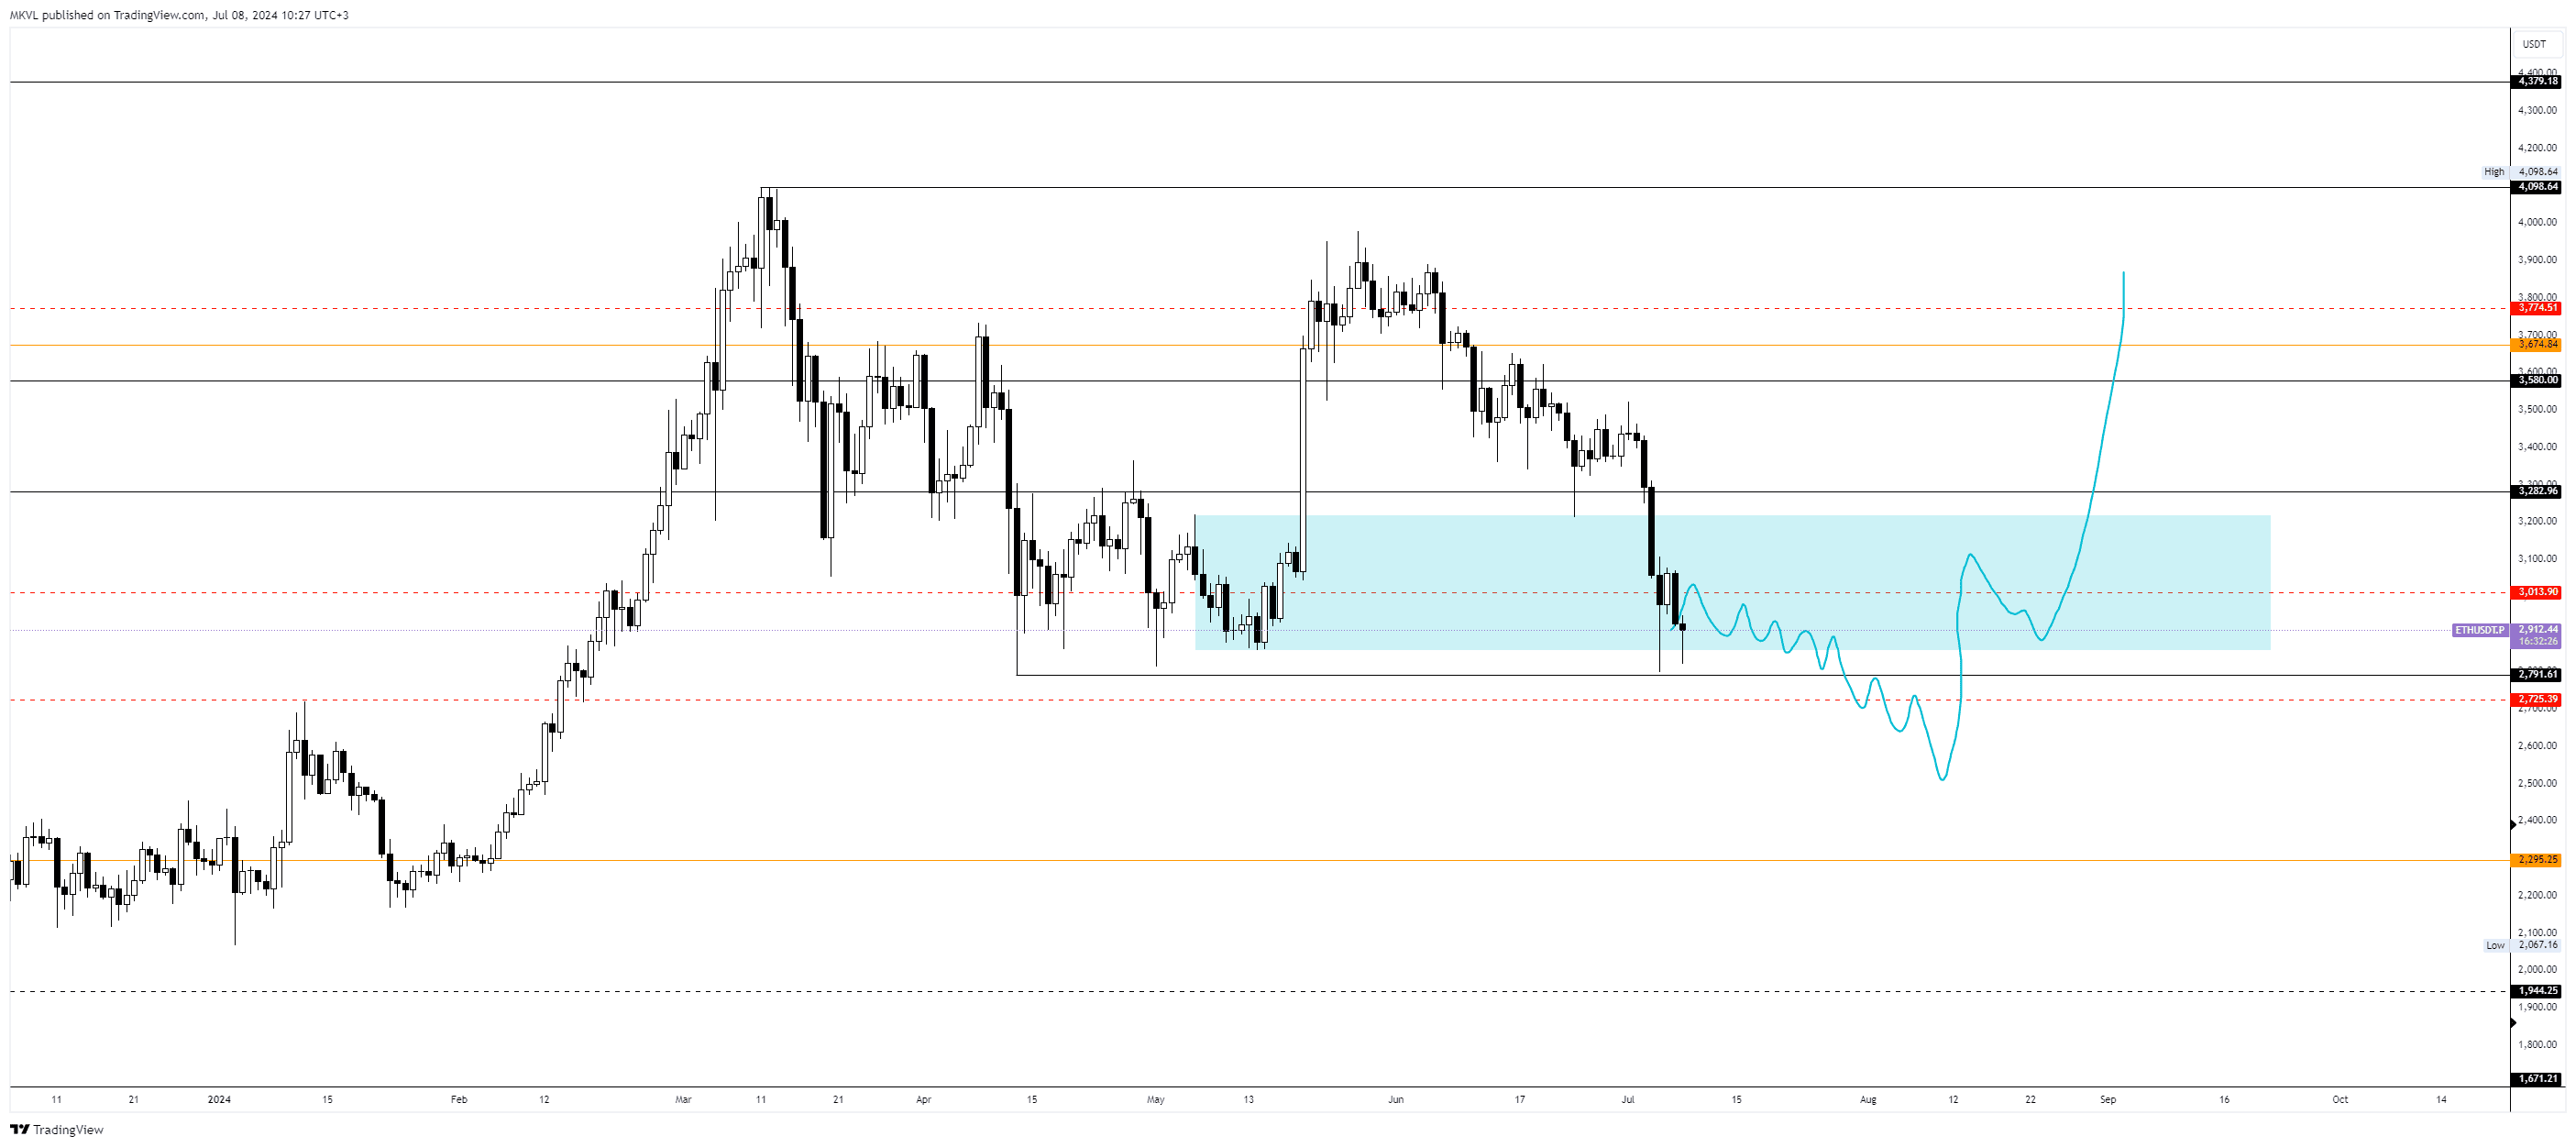
Вариантов для открытия длинных позиций на дневном графике пока нет. C учетом того, что не все каскады ликвидаций сняты и нас ждет огромный пул в диапазоне ниже $2800, нужно быть готовым к финальному краху.
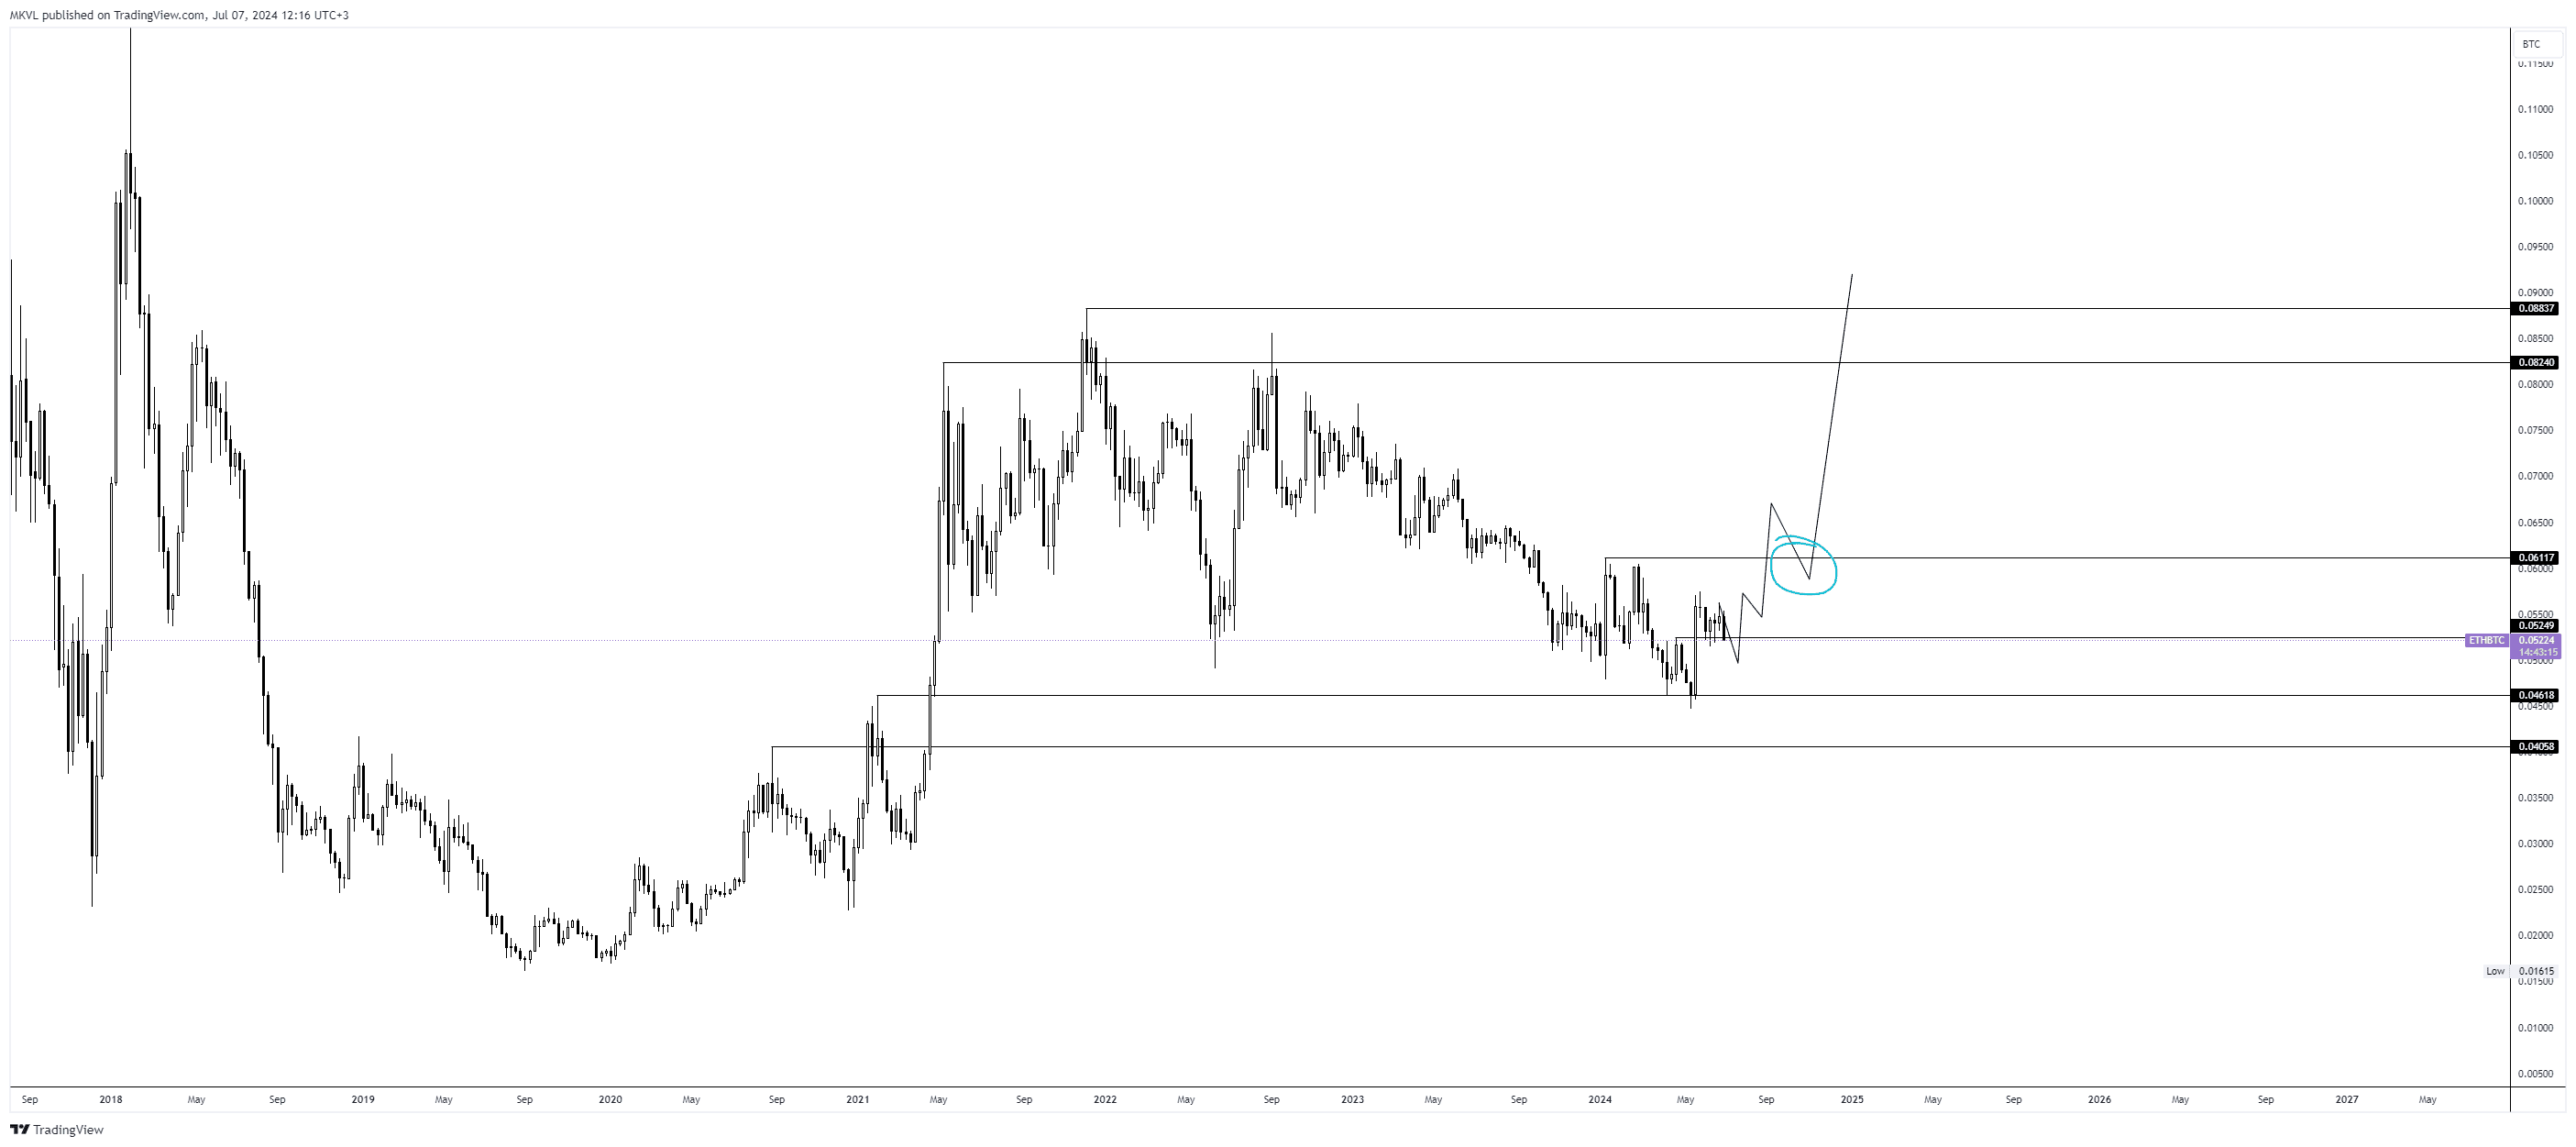
На недельном графике Ethereum к биткоину ситуация следующая. Мы нацелены получить вылет на 0,06 в период коррекции активов.